
September compresses the excitement of an entire baseball season into a few decisive weeks. Division leaders chase favorable playoff positioning, contenders search for late momentum, and individual performances carry greater significance as October approaches.
The Dodgers, Rays, Brewers, Yankees, Braves, Red Sox, and Cubs have each built distinct competitive identities in 2026. Those differences also influence how various baseball markets reflect their performances. Moneylines, early-inning lines, totals, and player props can reveal different dimensions of teams preparing for postseason baseball.
Dodgers Turn Consistency Into Moneyline Strength
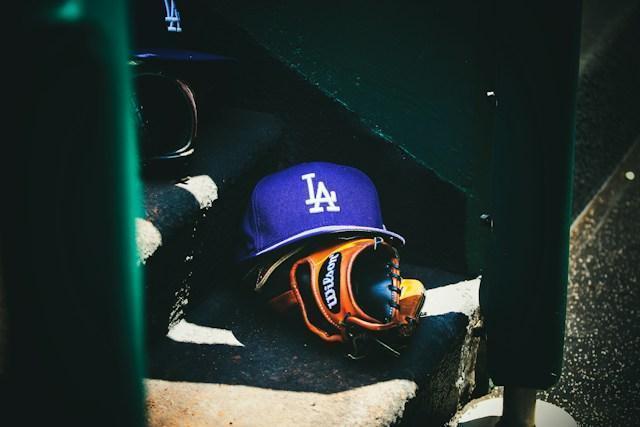
Los Angeles entered the closing stretch with 90 wins, a commanding NL West advantage, and one of baseball’s strongest run differentials. An eight-game winning streak further strengthened a season that has consistently placed the Dodgers among the National League leaders.
That profile gives betting lines considerable context. Los Angeles combines a deep lineup with enough pitching depth to win in different ways, which makes the team well suited to moneyline analysis.
Moneyline markets reduce complexity to a simple question: which team wins? They factor in the starting pitching matchup, lineup quality, venue, recent performance, and other factors when setting each side’s price.
That framework suits a Dodgers team whose 2026 success extends beyond one defining strength. Tampa Bay offers a different case, particularly when attention narrows to the opening innings.
Rays Put Early Control Under the Microscope
Tampa Bay has built its position through pitching and consistent winning. Rays starters carried a 3.59 ERA while averaging 8.10 strikeouts and only 2.09 walks per nine innings, providing stability before later relievers entered games.
The results support that foundation. Tampa Bay reached 88-59 and secured a postseason berth while leading the AL East, putting its ability to establish control early under greater scrutiny as October approached.
First-five-innings lines isolate that opening phase. They remove the later bullpen variables and focus attention on the scheduled starters and how each offense performs during its first trips through the order.
That makes starting-pitcher form, command, and early scoring particularly important when assessing Tampa Bay through first-five-innings (F5) markets. Milwaukee shifts the analysis from preventing runs toward producing them.
Brewers Make Run Totals Worth Watching
Milwaukee entered mid-September with baseball’s best record at 92-56 and had scored 762 runs while allowing only 570. The Brewers therefore paired sustained winning with one of MLB’s most productive scoring profiles.
September strengthened the offensive argument. Through their first 10 games of the month, the Brewers scored 76 runs, hit .303, and produced 14 home runs. That combination demonstrates how quickly their lineup can raise a game’s scoring ceiling.
Totals provide a different way to assess Milwaukee than straight-result markets. The total asks whether both teams will combine to finish above or below a predetermined run total, making opposing pitching and recent scoring patterns central considerations.
Milwaukee’s September production consequently gives totals additional context. New York narrows the focus further because its power can turn one swing into the defining event.
Yankees Keep Home Run Markets Relevant
New York entered the stretch run firmly in the AL playoff picture, carrying 84 wins and a +131 run differential. That production reflects a team capable of creating substantial separation across a long season.
Power remains an important component. Cody Bellinger and Luis García Jr. each recorded two September home runs through nine games, while both slugged above .600 during that span. Their production shows that the Yankees can generate home-run power from more than one part of the lineup.
Home run props isolate those explosive outcomes. Rather than asking how many total runs New York generates, these markets focus on whether a particular hitter clears the fence.
Yankee Stadium can also influence home-run matchups because its dimensions, particularly in right field, can favor certain hitters. Atlanta presents a different angle, with individual dominance coming from the mound rather than the batter’s box.
Braves Arms Put Strikeouts in Focus
Atlanta entered mid-September at 87-61 with 566 runs allowed and a +111 differential, numbers that kept the Braves among the National League’s leading teams heading toward October.
Chris Sale provides the clearest strikeout example. He’s averaged 11.04 strikeouts per nine innings while limiting walks to 1.74 per nine, producing a 6.34 strikeout-to-walk ratio. Those numbers demonstrate his capacity to generate outs without relying heavily on his defense.
Pitcher strikeout props separate that individual matchup from Atlanta’s final result. Opponent strikeout tendencies, expected workload, pitch count, and the starter’s swing-and-miss profile can all influence the posted number.
That lens makes individual pitching performance the central variable. Boston provides the opposite perspective, with run-producing opportunities spreading through its batting order.
Red Sox Depth Creates RBI Opportunities
Boston remained in the AL postseason chase in September after reaching 80-66, while its +84 run differential illustrated a season featuring meaningful offensive production. The lineup has also distributed run creation across several regular contributors.
Willson Contreras led Boston with 79 RBIs while carrying a .384 on-base percentage. Wilyer Abreu had 71 RBIs, Ceddanne Rafaela 70, and Jarren Duran 69, creating several sources of production rather than one overwhelming RBI leader.
RBI props depend heavily on opportunity. Batting order position, teammates reaching base, opposing pitching, and a hitter’s ability to convert runners in scoring position can shape each matchup.
Boston’s relatively broad RBI distribution makes lineup sequencing particularly relevant. It also completes a wider picture of how different markets highlight contrasting strengths among October contenders.
Cubs Turn Contact Into Hits Prop Interest
Chicago’s lineup adds a different dimension to hits markets than the power-focused Yankees. Pete Crow-Armstrong leads the Cubs with 160 hits, while Nico Hoerner has 154 and Alex Bregman 151, giving Chicago several consistent contact sources.
Insights regarding elite MLB players to watch as the regular season nears its climax show that Crow-Armstrong also carries a .281 average, while Seiya Suzuki sits at .270 and Hoerner at .267. Their production shows how Chicago can generate offense without relying exclusively on home runs.
Hits props narrow that production to whether an individual batter records a hit, making recent form, lineup position, opposing pitchers, and expected plate appearances important matchup variables.
Chicago’s balanced contact profile consequently creates several hitters worth tracking through these lines. That breadth adds another perspective to how October contenders can produce offense.
October Will Test Every Competitive Strength
No single betting market explains a team completely. Los Angeles brings sustained winning, Tampa Bay leans on starting pitching, Milwaukee generates runs, New York supplies power, Atlanta creates strikeouts. Boston and the Cubs spread run production throughout their lineups.
October will test whether those regular-season identities hold up against stronger opponents and shorter series. As postseason positions crystallize, moneylines, F5 markets, totals, and individual props provide different ways to interpret the same underlying question: which strengths can teams carry successfully into playoff baseball?